Creating an infographic can seem like a daunting task. Breaking down information, creating a nice guide for it all, making everything neat and clear to a reader- it’s a lot to do! But if you break down the process into a few simple steps, it can be much easier to figure out how to make the perfect infographic.
What is Your Information?
First, decide what information you need to get across in your infographic. Are you trying to teach people how to use something? Answering questions about an organization? Showing a certain set of statistics? Once you determine what you’re trying to communicate, you can determine the most effective way to communicate it.
Create an Outline
What are the pieces of information that are most important to get across? In what order do they need to be presented in? Creating an outline will give you an idea of how to organize your infographic. This outline can be as simple as bullet points or as detailed as a simple diagram of what you want your final infographic to look like- the only thing it really needs to do it give you an idea of what your final infographic will need to include and in what way you should include them.
Visualize Your Information
This is the most vital part of the infographic, what sets it apart from other forms of communication. It’s visual, so your information needs to be too. No big blocks of test here- make sure your information is set in a visual format.
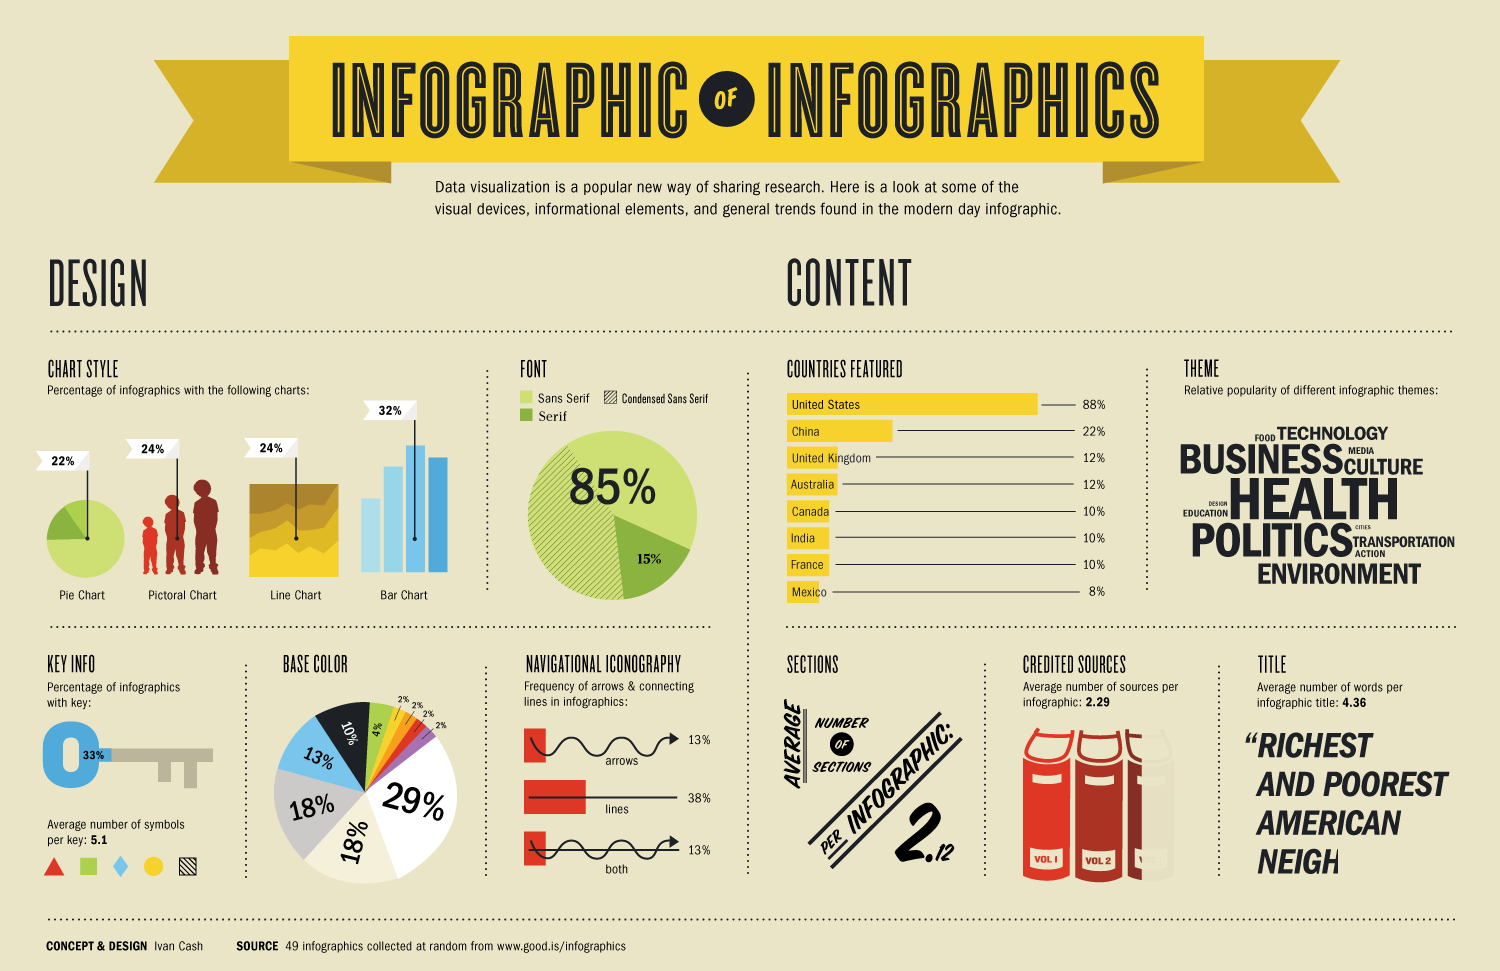
The first part of this step is to figure out what visual works best for your information. If you’re discussing a time frame, make a timeline. If you’re discussing differences in certain areas of the United States, a map might be useful. Numbers can be better represented as graphs and percentages as pie charts. Words can be used to explain the visuals, but the visuals are the most important part of the infographic.
The second step is to ensure that your visuals stand out. Make information that is more important stand out- bold or color words you want your readers to pay more attention to. If something is vital information, then make it bigger. Ensure that your information looks as vital as it is.
Organize Your Infographic
Make sure that your infographic looks neat and has a good flow to it. The reader’s eyes should move from one piece of information to the next seamlessly, without wondering where to go next. Your layout should be clear and follow the way people naturally read. Don’t make them look at the bottom right of the paper before going to the upper left. Ensure that the organization style also works with the information you’re presenting – if you’re comparing two different ideas, then two columns might work best.
Style
Last but most certainly not least is ensuring that the style and tone of your infographic matches the information you’re presenting. An infographic about poverty probably should not be bright and cheery, while one about the favorite songs of toddlers should not be presented grimly. Ensuring the style fits the tone is vital for making sure people take your work seriously.
Infographics are great ways to get information across to a wide audience. With these tips, you will be able to make clear, informative infographics.
